While the U.S. national election headlines have occupied the space usually reserved for COVID-19 related stories, there is still much to report about the progression of the pandemic. Across Missouri, including Clay County and Kansas City, the stakes of the pandemic are heightening. Such is also the case for both the U.S. as a whole and several countries around the world. Read on to find the most recent local information about the status of COVID-19 in Clay County, Kansas City and Missouri.
Clay County
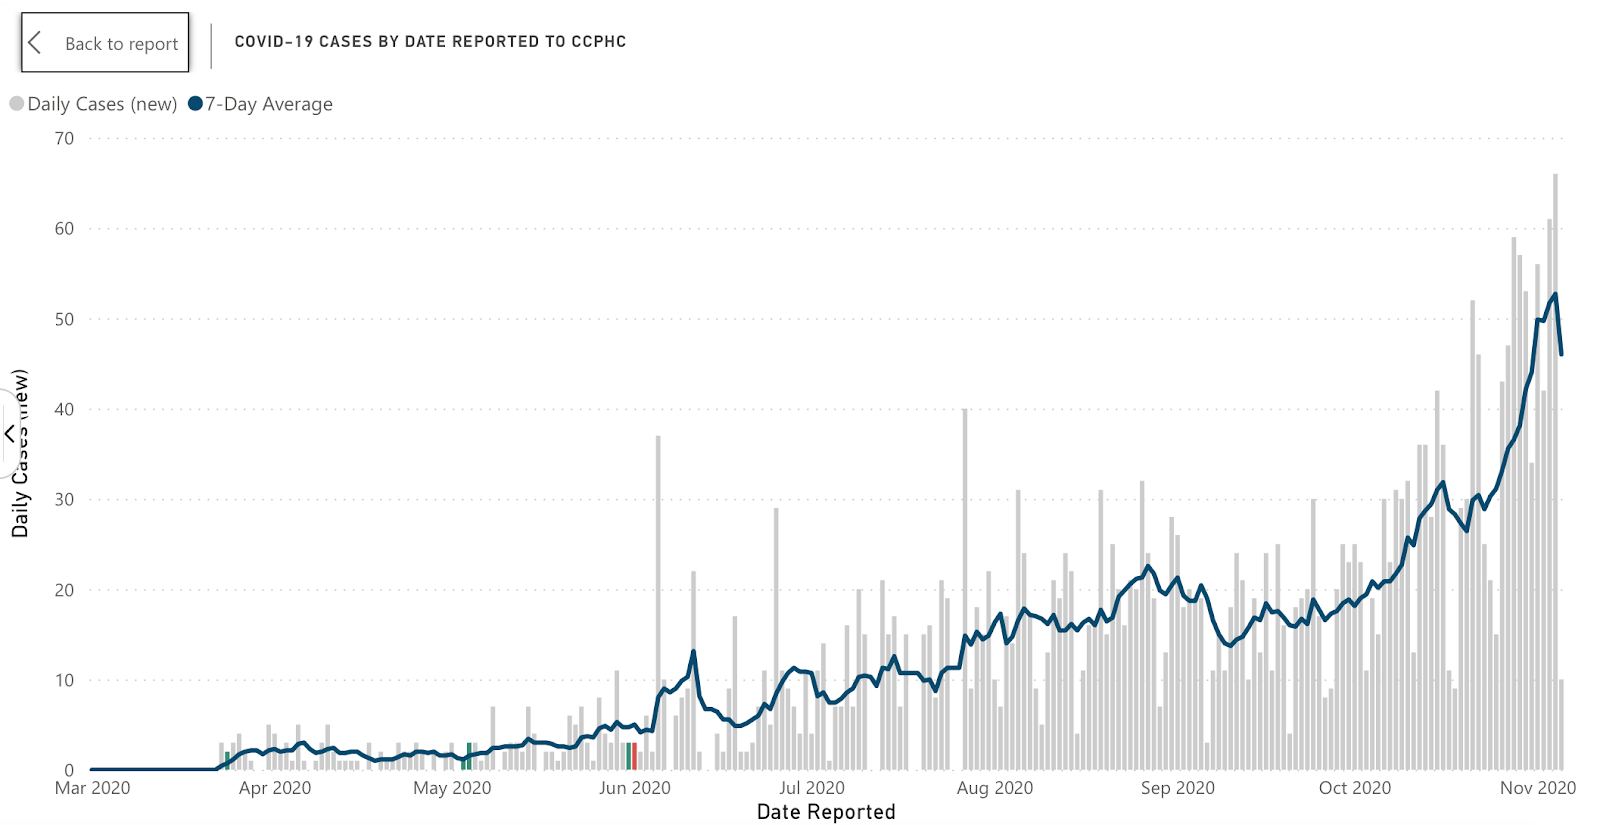
As William Jewell College moves to Operation Safe Campus threat level C after a cluster of students on the football team and within the Kappa Alpha fraternity house tested positive, Clay County has seen a growing number of confirmed cases.
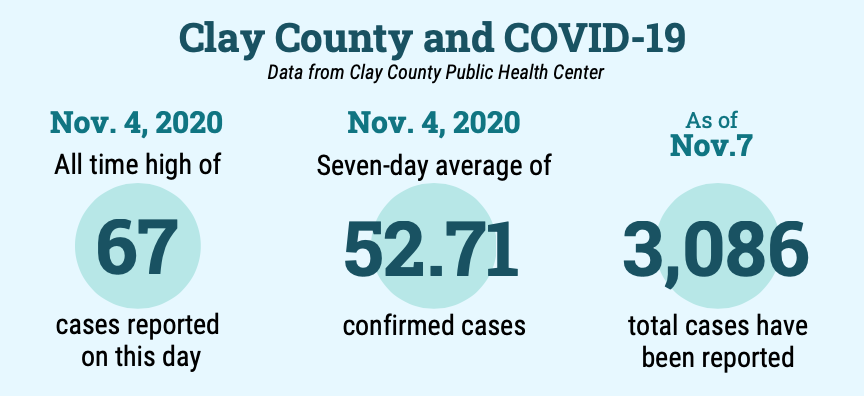
On Nov. 4, the County hit a grim milestone – the highest number of daily cases reported to the Clay County Public Health Center (CPHC) on record. Within the county, 67 cases were reported on this day. The seven-day average of confirmed cases was 52.71 Nov. 4. This is an over two-fold increase of the seven-day average exactly a month earlier, which was 20.86.
By comparison, the seven-day average of cases on April 4 – just before Gov. Parson initiated the statewide lockdown – was 2.14.
As of midday Nov. 7, the total number of cases reported to the CPHC is 3,086.
Information about COVID-19 in the Clay County area, including epidemiological data, recovery data and school gating criteria can be accessed at the CPHC website, linked here.
Kansas City
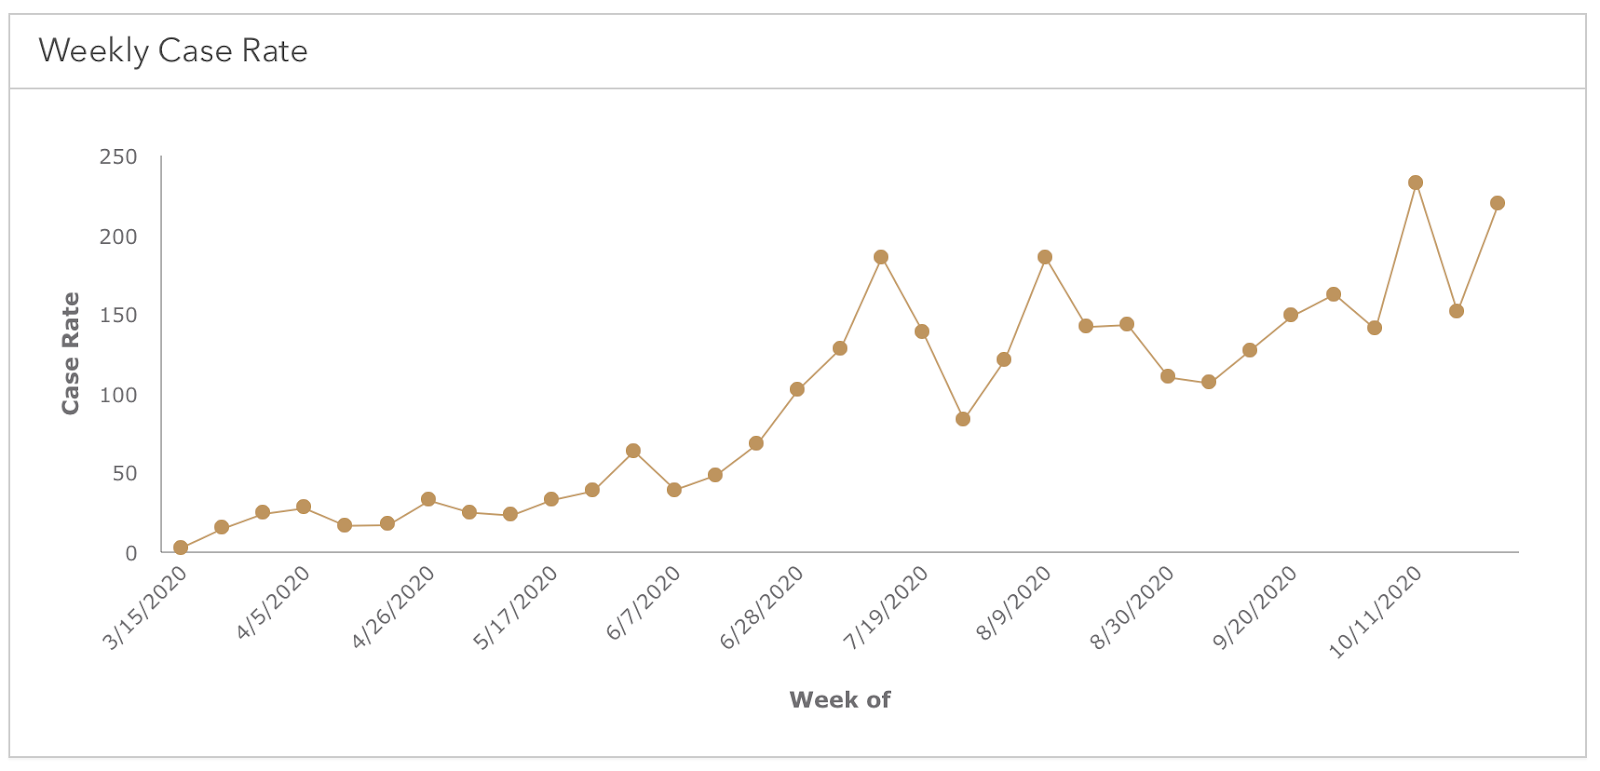
Kansas City is seeing a concomitant rise in weekly reported cases. Updated most recently to indicate the weekly case rate for the week of Oct. 26, the KCMO Health Department recorded a steady rise in reported cases since the beginning of September. Kansas City reached an all-time high in the week of Oct. 11 with an average daily case rate of 232.65. This rate dipped in the week of Oct. 18 to 151.43 only to rise almost back up to that record level, with a case rate of 219.34 in the week of Oct. 26.
Kansas City’s positivity rate – measured as a proportion of the number of positive COVID-19 tests to the number of total COVID-19 tests taken in Kansas City – also hit a record high in the week of Oct. 11 at 16.14 percent. The rate dipped to 11.81 in the following week and has risen again to 14.16 percent in the week of Oct. 26.
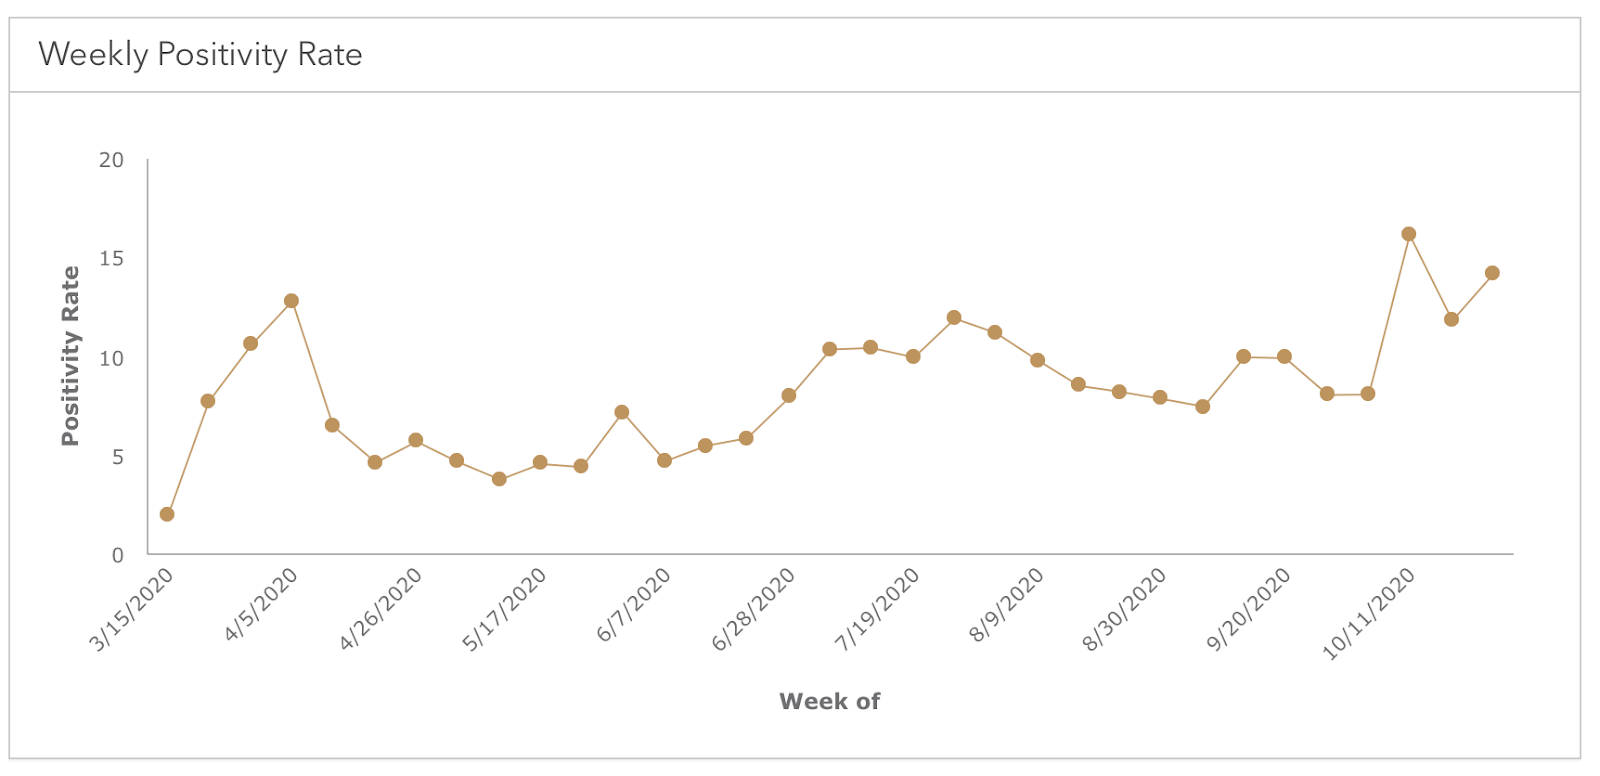
KCMO Health Department notes that Kansas City should be aiming for a positivity rate of about five percent, which would indicate that transmission of the virus is low and enough people are being tested.
Across Kansas City, the age group that reported the most cases of COVID-19 were 20- to 29-year-olds, who reported 445 cases in the past two weeks as of Nov. 7, according to the KCMO Health Department.
Chief medical officers across Kansas City hospitals have shared that they are dangerously close to reaching capacity due to COVID-19 hospitalizations.
Kansas City’s COVID-19 epidemiological data and testing resources are accessible at the KCMO government website, linked here.
Missouri
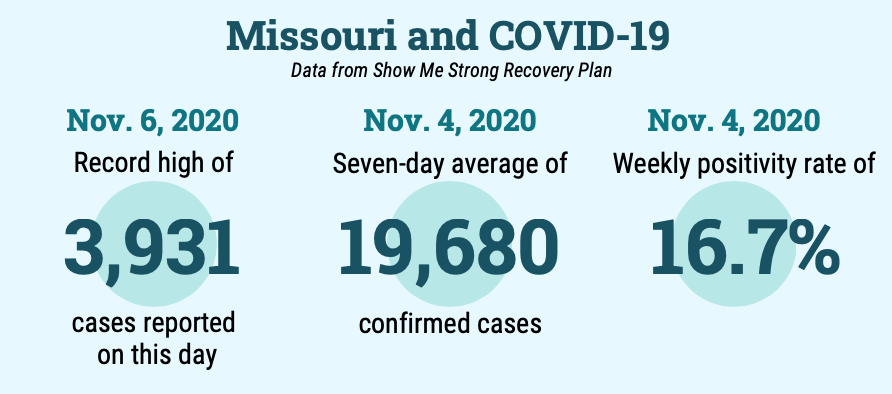
Missouri as a whole is reflecting these local trends. According to information from the Show Me Strong Recovery Plan website as of Nov. 7, there was an average of 19,680 cases across the state between Oct. 29 and Nov. 4, with an average of 2,811 per day.
Yesterday, Missouri reported a record high of 3,931 newly confirmed cases, which officially brought the state’s total number of cases to over 200,000. This most recent figure has not been factored into the Show Me Strong Recovery Plan’s seven-day average as of yet.
According to the Show Me Strong Recovery Plan, Missouri has recorded 321 cases of COVID-19 per every 100,000 people and 1.4 deaths from COVID-19 per every 100,000 people, both within the past seven days. These per-capita numbers put Missouri at number 16 and 10, respectively, out of all 50 states.
Missouri’s positivity rate is at a seven-day average of 16.7 percent.
As of Nov. 4, there are 1,826 beds occupied by coronavirus patients in Missouri hospitals. The rapidly growing number of hospitalized coronavirus patients is forcing Missouri hospitals to consider contingency plans in the event that they reach capacity in the coming weeks.